Aviation Weather App for iPhone | iPad
The AeroPlus Aviation Weather App provides aviation weather in a visual way: a picture says more than a 1000 words. However, the textual data is also available.

The app is developed for iPhone and iPad.
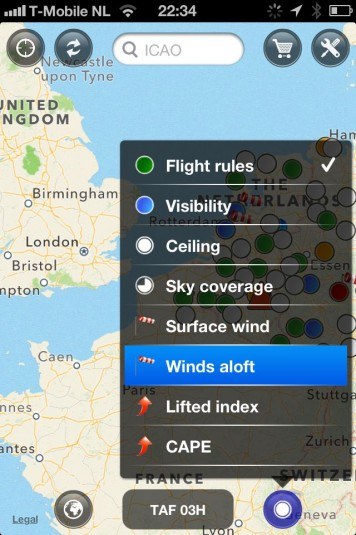
Some of the information we provide in the app might be new to many pilots. The new weather data was not readily available until recent. The winds aloft data we provide is displayed dynamically on the chart. You can drag the flight level scrollbar and see how the winds aloft in a specific area changes with changing altitudes. The CAPE and lifted index values provide information on the convective energy you can expect and the risk of thunderstorms.
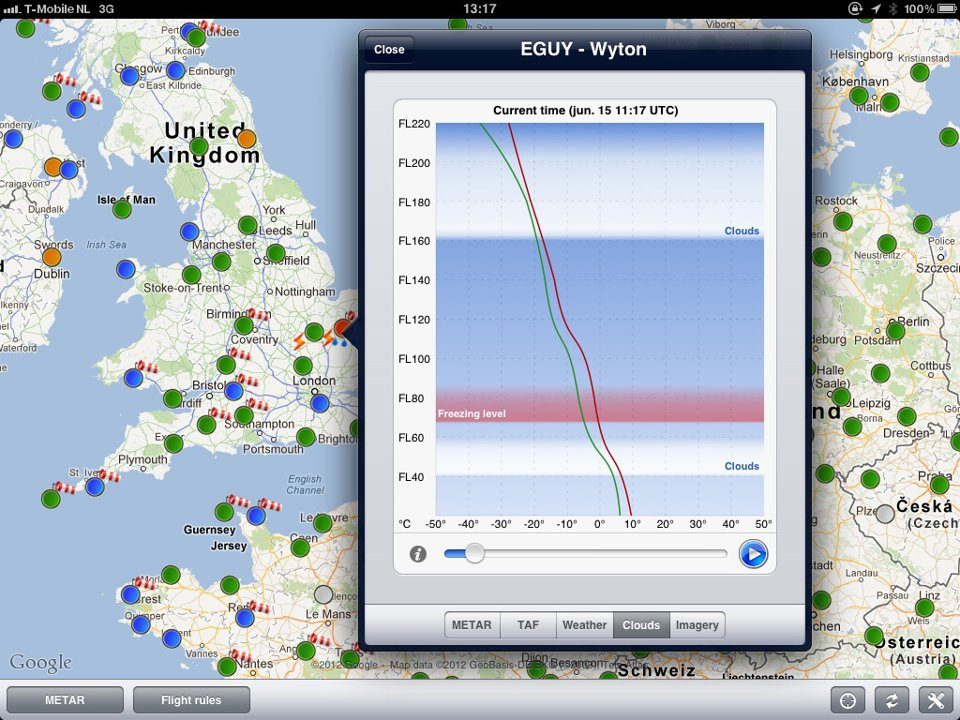
Clouds Diagram
The Clouds Diagram in the AeroPlus Aviation Weather App is a simple representation of a Skew-T Log-P diagram. This diagram is often used by meteorologists to create a visual snapshot of the atmosphere. On the horizontal x-axis, we show the temperature in degrees Celsius. On the vertical y-axis, we provide the altitude in flight levels. The red line shows the dew point temperature aloft. The green line shows the ambient temperature aloft. When the dewpoint temperature is reached, the relative humidity in the air will be 100% and clouds will most likely form.
The Clouds Diagram gives an indication of the possibility of clouds forming and where, and if the clouds to expect will be layered or solid all the way up to above e.g. FL200. Next, it shows the convective energy in the clouds (darker coloured clouds) to expect and shows a prediction of the top-of-clouds. The red horizontal tape depicts the freezing level. The temperature zone between zero and -20 degrees Celsius is considered a danger zone with possible icing risks when flying in the clouds.
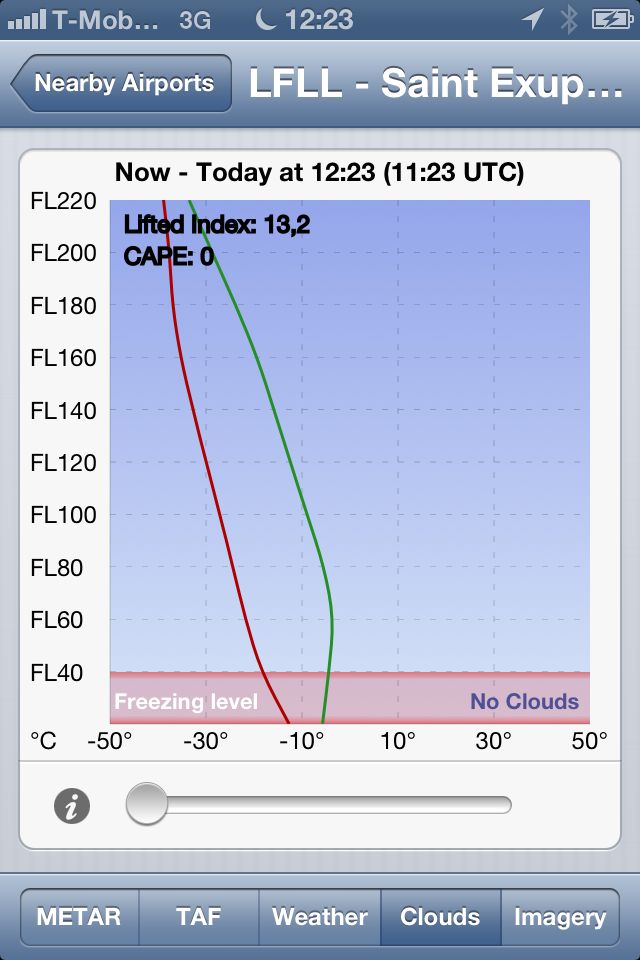
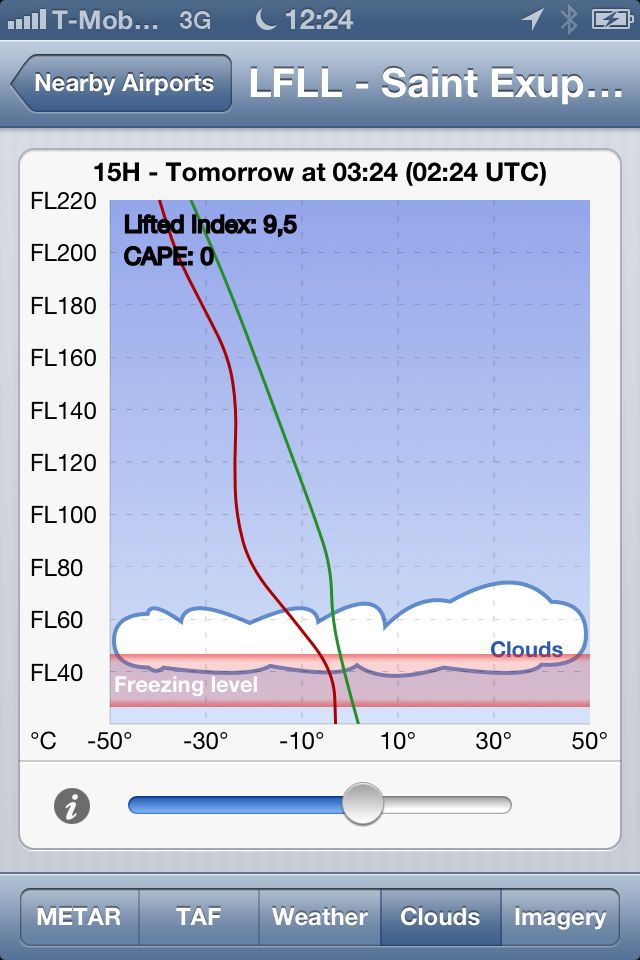
The above 2 Clouds Diagrams provides some interesting information.
First of all, the left Diagram shows that the ambient and dew point temperature are quite far apart, thus making it very unlikely that clouds will be formed. Second, in the right Diagram we see the 2 temperature lines merging closer together and diverting away from each other again, but not touching. When the two lines merge together but will not touch each other, we could possibly expect some clouds, but where they divert from each other we can expect the clouds, if any, to disappear again. The colour of the clouds (white, light grey or dark grey) serves you information on the convective energy to expect in the clouds. Darker clouds may result in less stable air and eventually develop into thunderstorms. See the part on convective energy below for an explanation.
Combine interpreting this clouds diagram with the information provided in the METAR and TAF section on cloud ceilings and combine this then again with a good look at the infrared (IR) cloud-top temperature satellite images to get a forecast of where to expect the top of clouds.
AeroPlus Aviation Weather App features
Apart from giving you information on the cloud tops and type of clouds to expect, the AeroPlus Aviation Weather App accommodates additional weather information to help prepare for the flight.
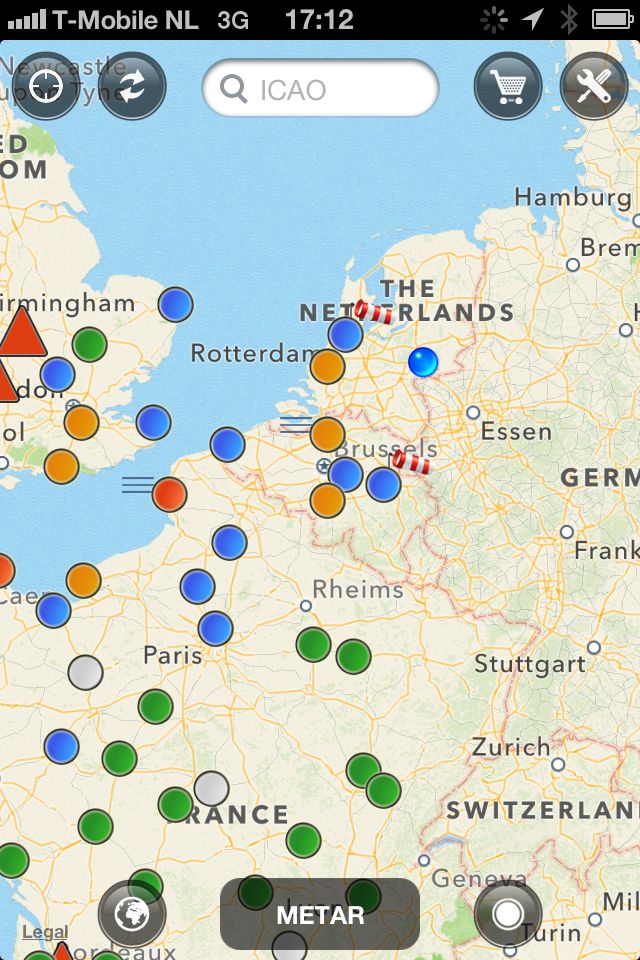
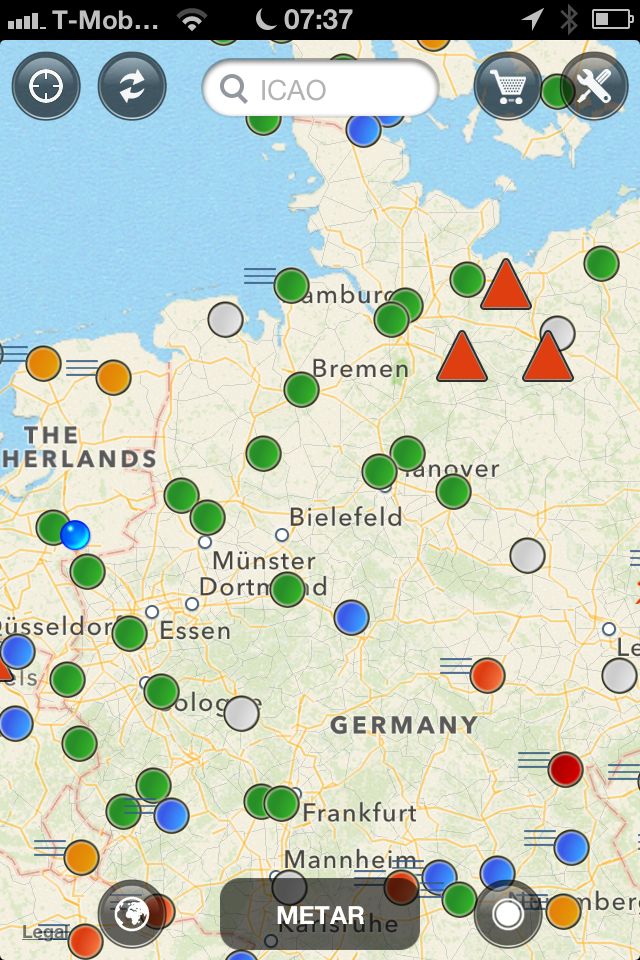
The “Flight rules” option gives you an overview like above on the right. Either the METAR or the TAF is shown. You can slide the METAR slider at the bottom to show the weather 24 hours ahead. Green icons exhibit VFR weather, blue icons mean marginal VFR, orange and red icons depict either IFR or intensive IFR weather. Mist, Fog, heavy winds or thunderstorms are depicted as well with picture icons. A red triangle displays a SIGMET . Click on any of the icons to see more detailed information. You can zoom in or out on the map to get a better overview of the weather forecast in a larger area or en route.
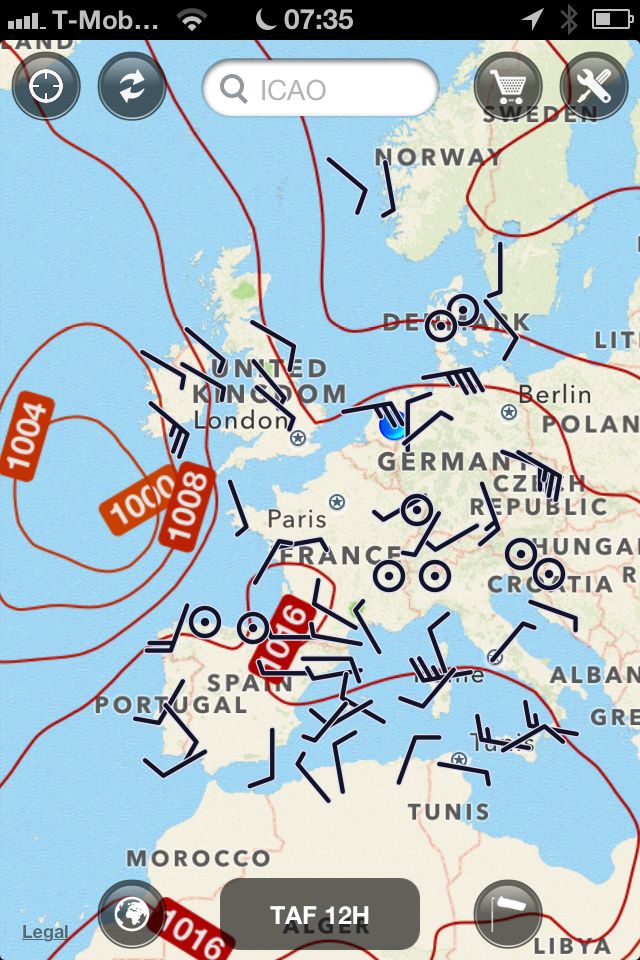
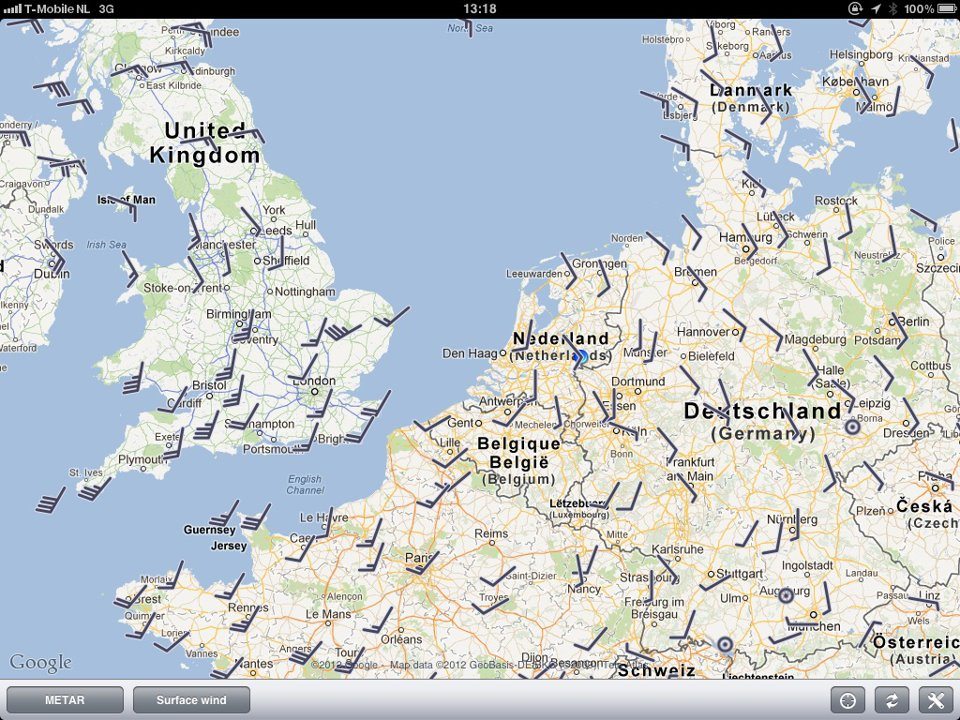
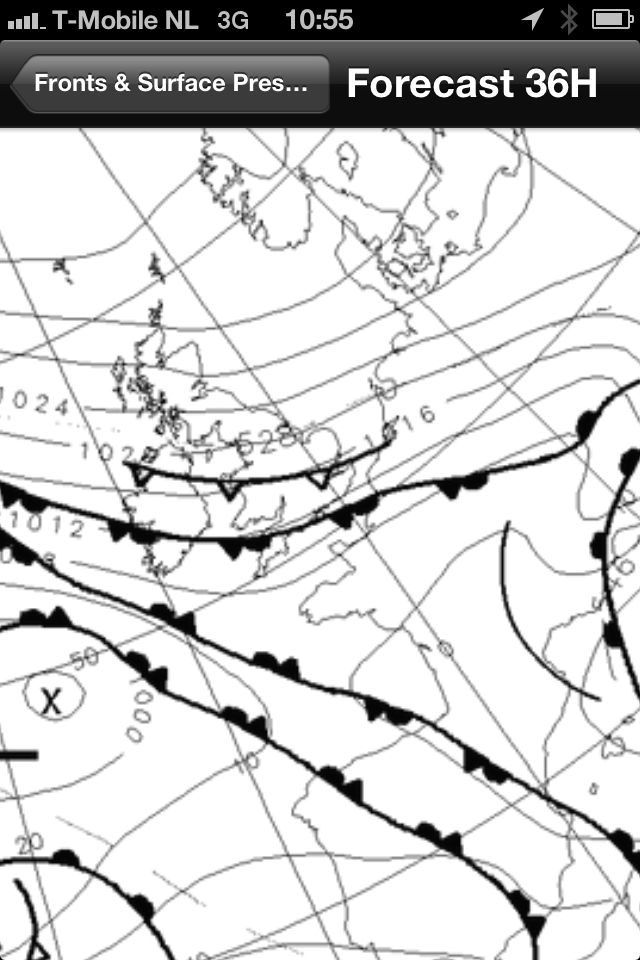
Dynamic pressure charts
The pressure chart and surface wind chart below are build dynamically and merged into one overview. Zoom in to get more detailed information. Use the scrollbar at the bottom to move ahead in time (TAF) or see the current weather (METAR).

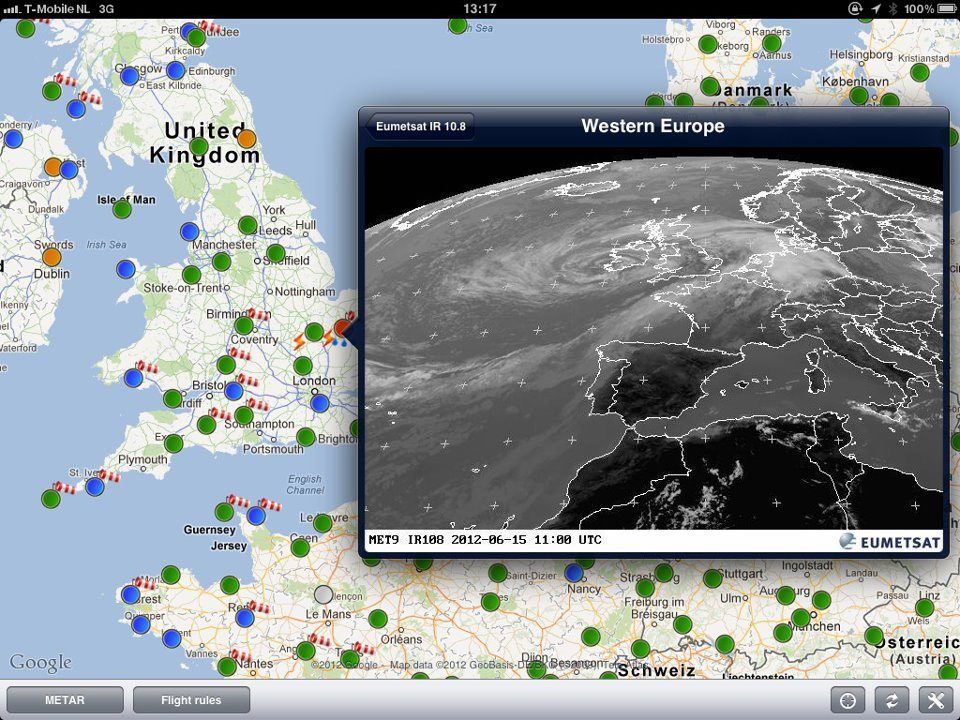
The infrared cloud-top temperature satellite image gives you like a cloud-top METAR. Unfortunately, there is no temperature scale provided, but with a little bit of experience, you will be able to get a rough idea of where the tops of clouds are and if they will be closer to FL100 than to e.g. FL300. Very white clouds are very cold and must be very high in the atmosphere. Light grey clouds are not that cold and will be most likely not that high in the atmosphere. It takes a little time to learn to interpret this sat image, but together with the Clouds Diagram, you can get good estimates of where to expect top-of-clouds. The Clouds Diagram data comes from predictive weather forecasting models. The sat image is like a visual snapshot of the current situation.
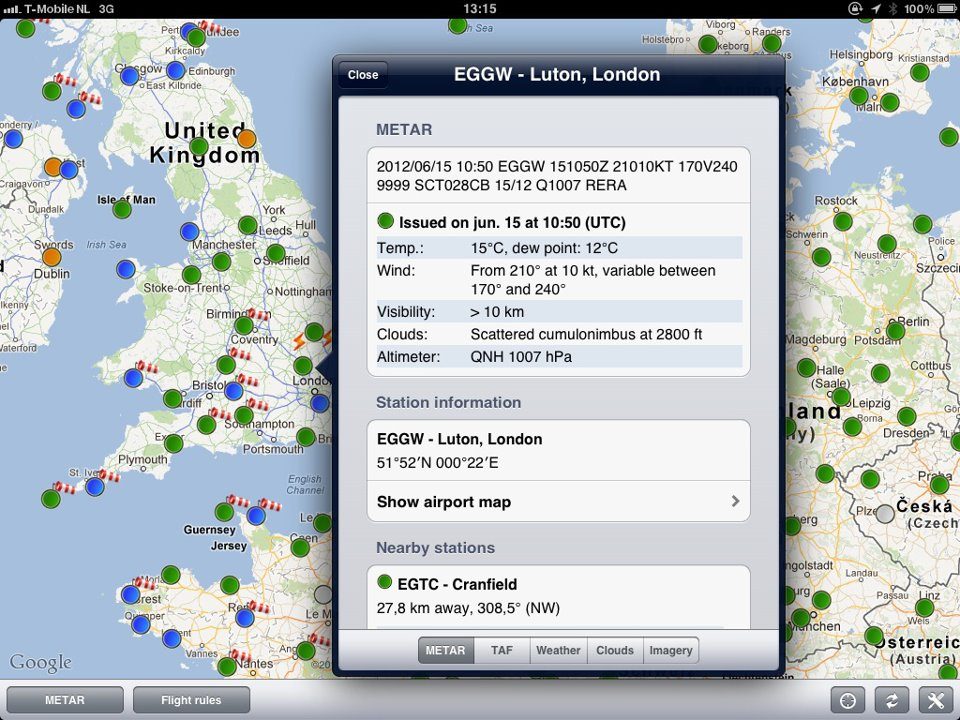
Clicking on an icon shows you detailed information on that location.
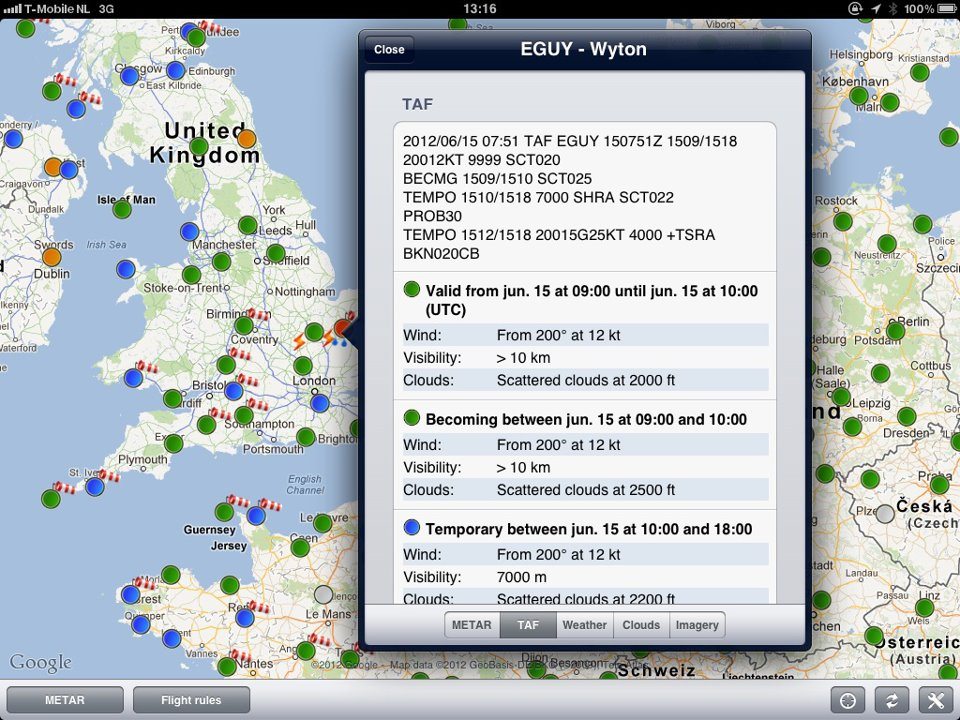
METAR and TAF
If the airfield has a weather station, you will find here the METAR, TAF as well as further weather information such as wind speeds and direction at different flight levels, the relative humidity figures and significant weather charts. the METAR and TAF provide the cloud ceiling. This ceiling is where the clouds are broken and should be read at the bottom of the clouds, not the tops and may only provide data up to 5000 feet. As you can see, the information on clouds forming can be taken from several sources of which some are predictive in nature and based on a weather model, others are actual observations like in the METAR. Combine all the information to get a good overview of what kind of weather to expect.

Lifted Index
The numerical value of the Lifted Index gives you a good indication of whether the air is potentially stable or unstable. A Lifted Index number of zero indicates air that is neutrally stable. A Lifted Index number above zero indicates stable air. A Lifted Index number below zero indicates potentially unstable air. Lifted Index 0 to -2 means weak potential instability of the air mass. A Lifted Index value of -2 to -6 means that the air mass is likely moderately unstable and if the Lifted Index value is smaller than -6, the airmass is potentially very unstable and could indicate a high possibility of Thunderstorm activity. For Thunderstorm activity, the airmass does not only need to be unstable, but also include a lot of moisture amongst other factors, but a negative Lifted Index number is a good first indication to watch out and check against other sources for potential weather hazards.
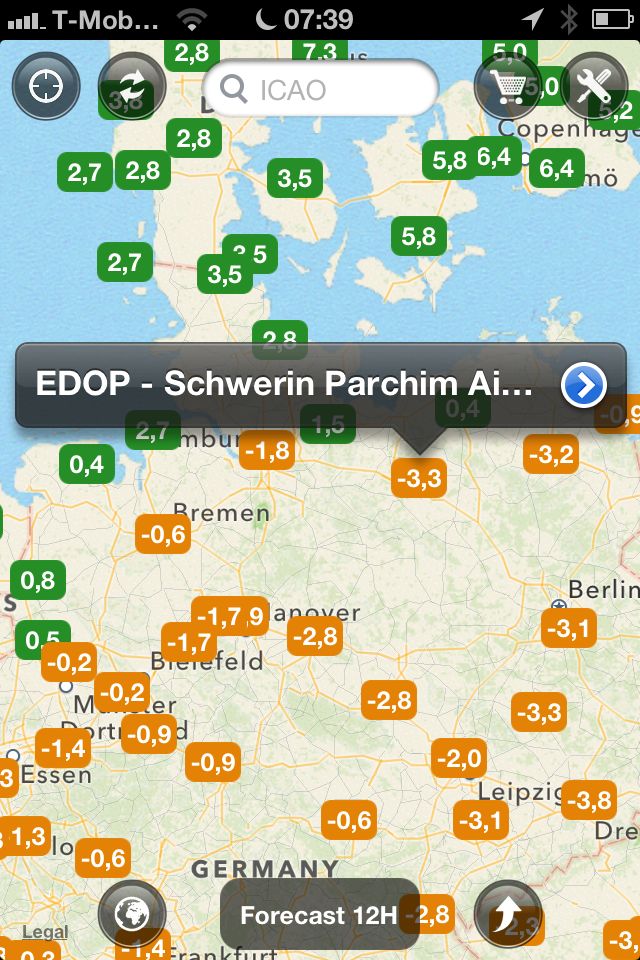
Lifted Index and CAPE values on the chart.
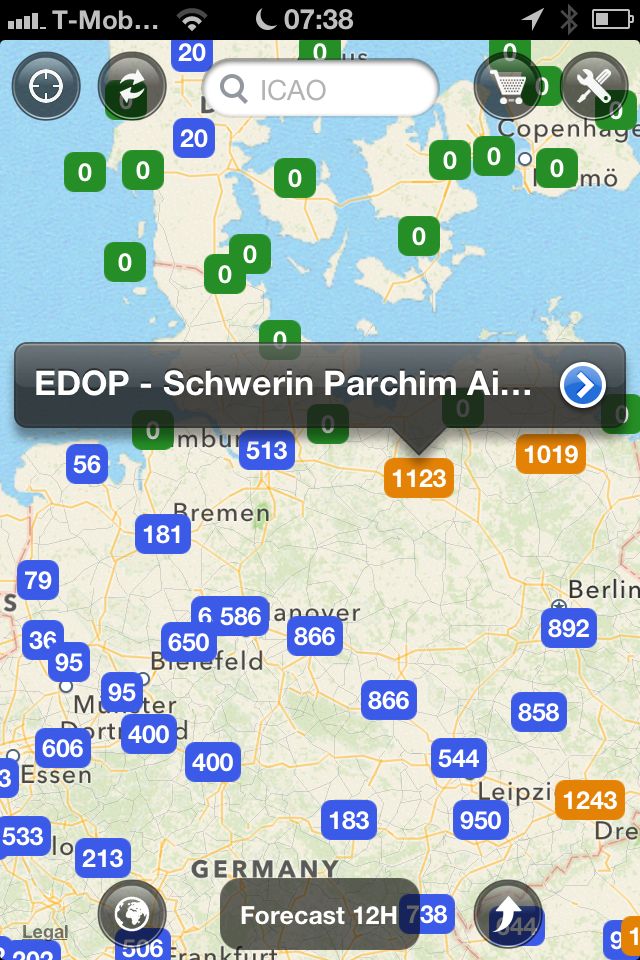
CAPE value
CAPE stands for Convective Available Potential Energy and is a measure of joules of energy per kilogram of air. The larger the CAPE value, the more potential energy trapped in the air. It is another means of measuring how potentially unstable the air might become. A value of 0 means Stable air. A CAPE value between 0 and 1000 means Marginally Unstable air. Is the value between 1000 and 2500, then the air mass is potentially Moderately Unstable, 2500-3000: Very Unstable and more than 3500 for the CAPE value indicates potentially Extremely Unstable air with a very high potential for Thunderstorm activity.
Sigmets
Sigmets are depicted with RED triangles on the chart. Click on the triangle to get more information on the Sigmet message.
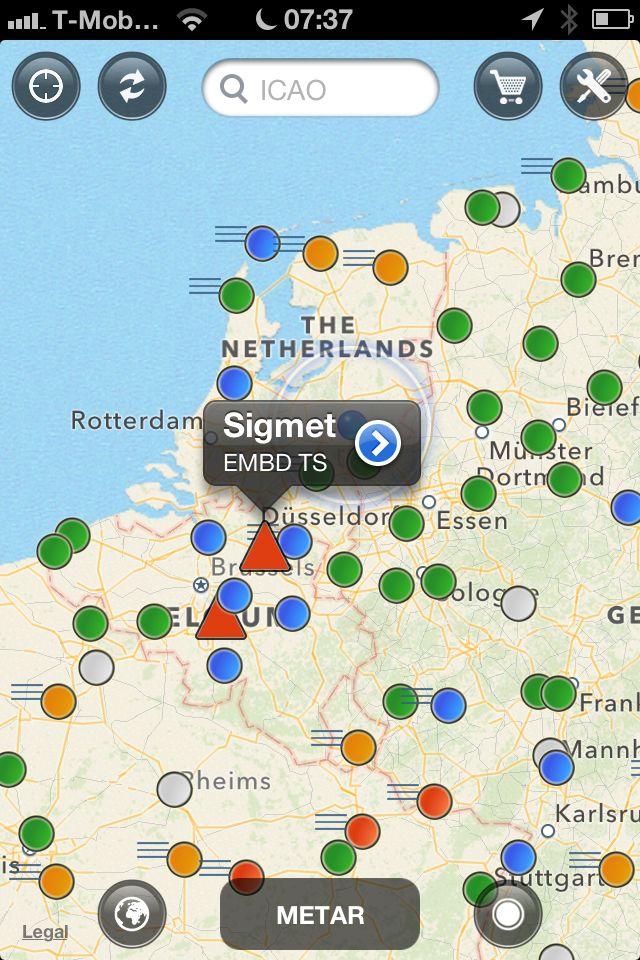
Sigmet information: Embedded Thunderstorm.
Significant weather charts
The AeroPlus Aviation Weather App includes a number of significant weather charts. These charts enable you to complete the total picture and forecast.

Significant weather charts on your iPhone or iPad.
In-flight weather
AeroPlus is testing the in-flight weather features or the AeroPlus Aviation Weather app in combination with the SAT link device.

I would say, check out this app in the Apple Appstore and see for yourself what this great app can do for you. The app is available for free including the METAR data. The TAF is added for a one-time small fee. The other weather data is made available on a subscription basis.